Part of my job involves the audit of Google Analytics setups in order to establish the quality of the data collected. This video story brings together some of the extraordinary findings of my work. Its a study of 75 enterprise websites using Google Analytics. I describe the audit methodology and display the results in a visual scorecard format.
The results are somewhat surprising (and depressing) in that they show the general poor quality of data that organisations are working with. For example:
- Average Quality Index score of only 35.7 out of 100.
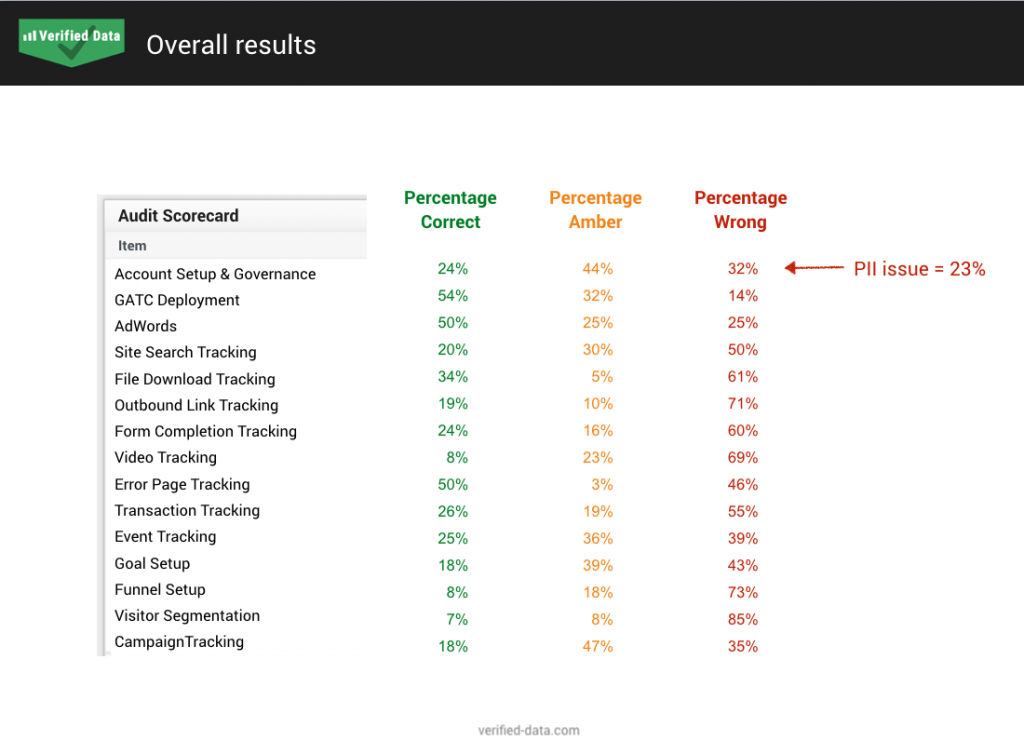
- One in five websites have a PII issue i.e. were collecting personal information into GA.
Presentation, 20 mins:
Summary Slides
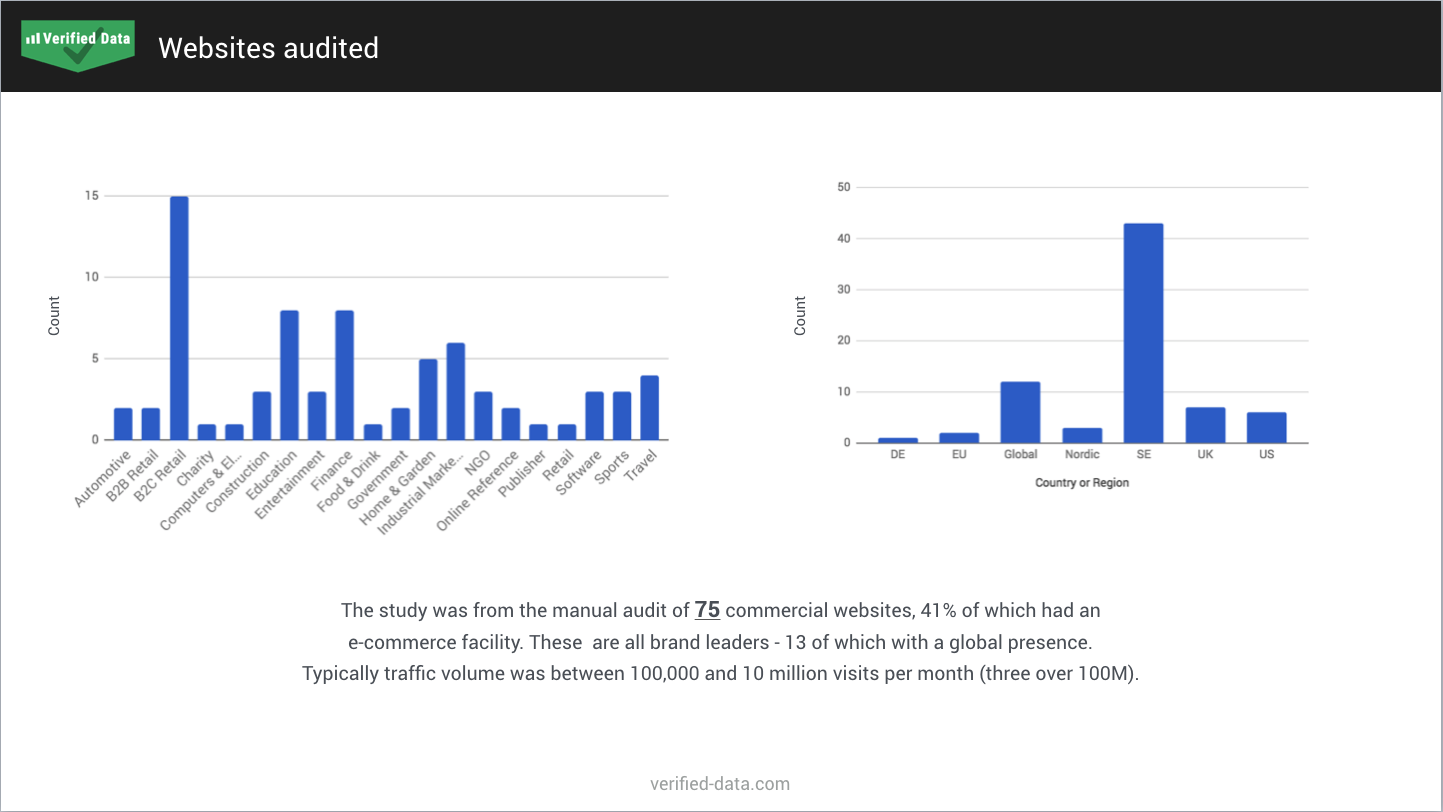
1. Who this study audited
The graphs show the type of website (its vertical) and the geolocation of target audience. Note all audited websites are enterprise organisations – mostly very well known brand leaders that requested help with their Google Analytics.
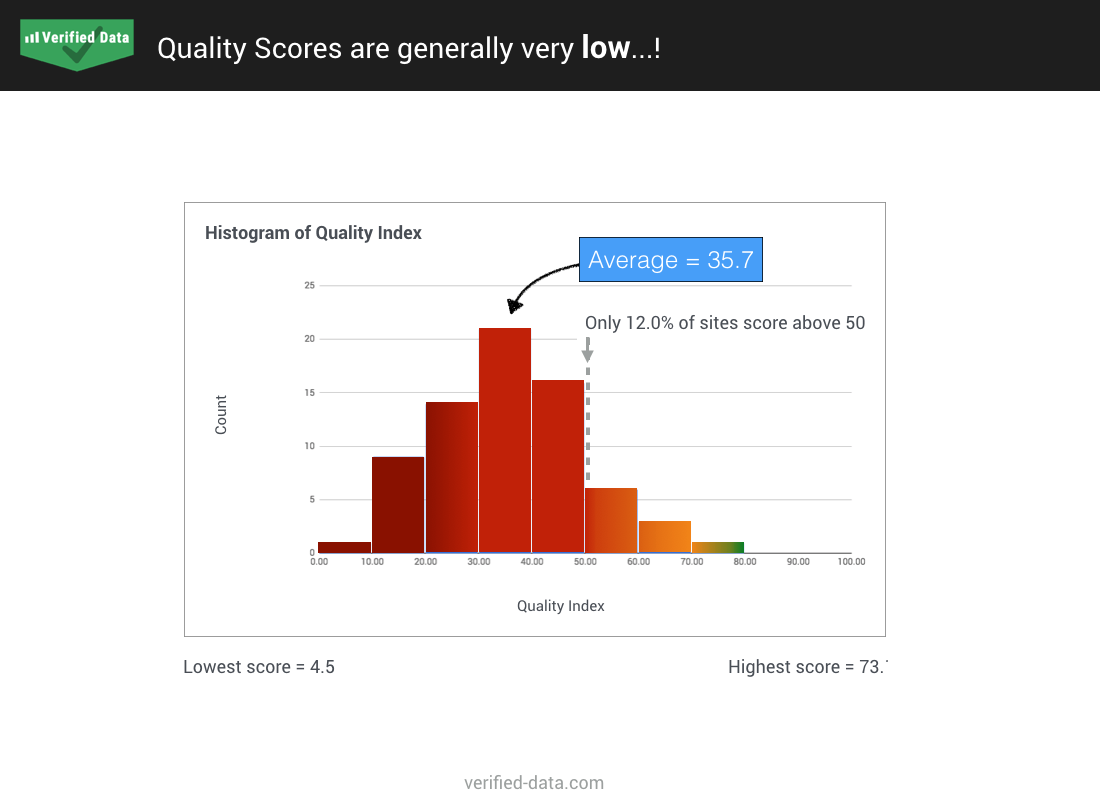
2. Overall Audit Results Distribution
This slide reveals the result distribution of audited Quality Index scores. The maximum value = 100 and this represents an ultimate best practice implementation and setup of Google Analytics. That should always be your ambition. However, in reality the aim is to consistently maintain a Quality Score above 80.
The slide reveals:
- A lowly average Quality Index score of 35.7
- Only 12% of sites score above 50 – a score I insist on exceeding before analysing data
- Only a single website scored above 70
3. Quality Index Breakdown
Although all areas have problems, visitor segmentation is the most poorly understood/implemented feature of Google Analytics – only 7% of website get segmentation right. Segmentation is a key requirement to be able to perform any kind of in-depth analysis of data. By default GA has some great default segmentation tools. However, these are at the session level – they do not tell you about your users i.e. real people. Read my definition of what is tested with respect to visitor segmentation.
BTW, if you are interested in what I am building in this space – a forensic GA data auditing tool with an emphasis on GDPR compliance – visit verified-data.com.


Interesting study Brian, it would be interesting to get an idea what sort of time frame you would project these companies might need to get there reporting into the green?
Hello Tristan. Of course the answer is – it depends. Probably the easiest/quickest route is if GTM is already in place, but even then structural or governance issues require a strong internal leader to take the reins and push changes through.
The other side of that question is, how long does it take until green items start to go sour? A PII issue can happen at any time. For other items, a highly active site can degrade its data within a few weeks/months. Essentially the stronger the governance regime, the longer good data can stay good.
Those are general answers I know, but every org/site is literally quite different.